How Teachers Can Use Census Data for Classroom Activities
Census data activities give teachers an easy way to turn real-world information into meaningful lessons students can analyze, discuss, and apply. From graphs and population trends to community comparisons, these activities make learning more engaging and relevant across subjects.
By: Jennifer Collins on July 28, 2026
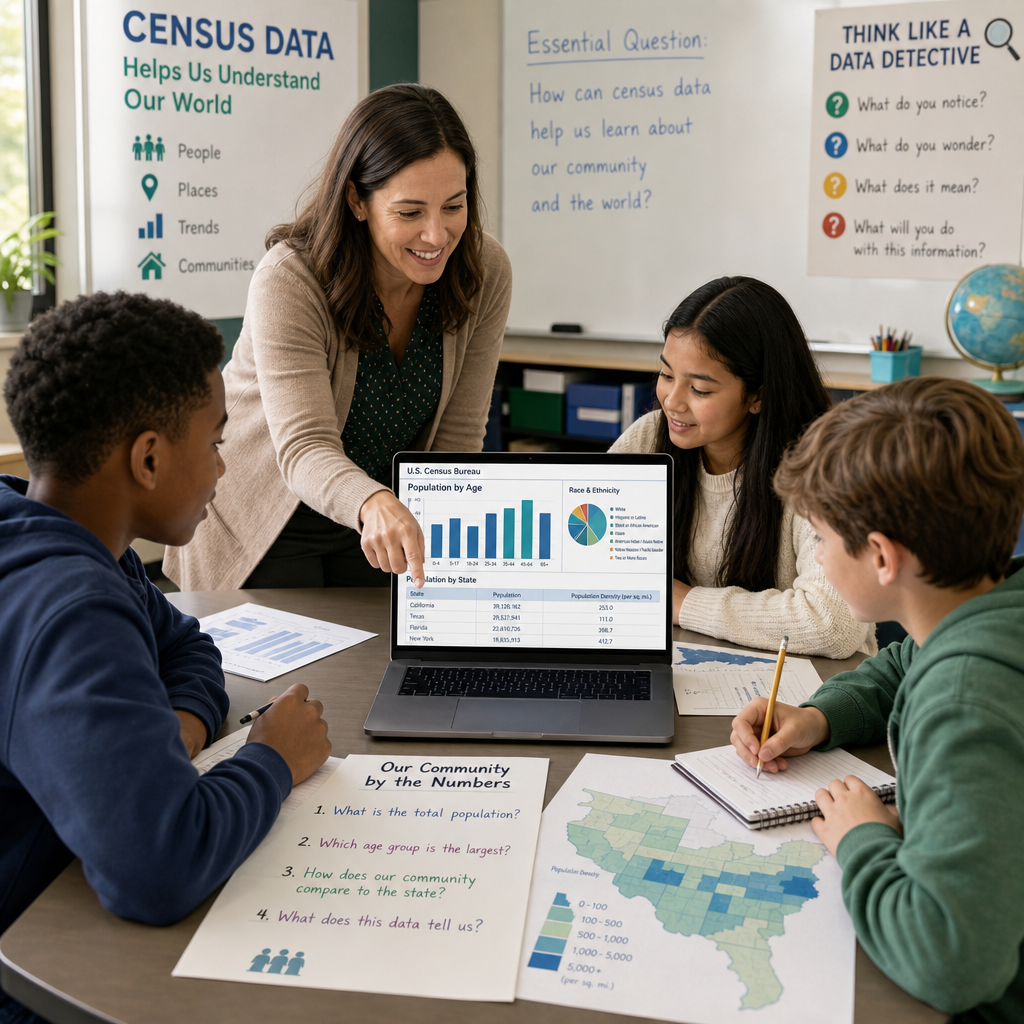
Census data is one of the most useful real-world resources teachers can bring into the classroom. It offers a rich picture of communities, populations, households, jobs, education, language, and more. Because it comes from an official source and is updated regularly, census data gives students a chance to work with authentic information instead of invented examples. That makes lessons more engaging, more relevant, and often more memorable.
For teachers, census data can support learning across subjects. In math, students can analyze charts and compare numbers. In social studies, they can study population changes and community development. In language arts, they can write arguments based on evidence. Even science classes can use demographic patterns to explore environmental or public health topics. With a little creativity, census data becomes a flexible tool for building classroom activities that are both practical and interesting.
Why Census Data Works Well in the Classroom
Census data is valuable because it connects classroom learning to the real world. Students often ask, “When will I ever use this?” Census data provides a strong answer. It shows them how data shapes decisions about schools, roads, hospitals, public services, and representation.
Here are a few reasons it works so well:
It is authentic. Students work with data collected from actual communities.
It is current. Census information reflects real population trends and changes over time.
It is versatile. Teachers can use it in math, social studies, economics, geography, and writing.
It builds critical thinking. Students learn to interpret graphs, identify patterns, and ask questions about evidence.
It supports civic understanding. Census data helps students see how governments and communities use information to make decisions.
Because census data can be local, national, or international, teachers can adapt it to almost any grade level and learning goal.
Getting Started with Census Data
Before designing classroom activities, teachers should choose the right type of data for the lesson. Census information can include population size, age groups, household income, race and ethnicity, language spoken at home, housing type, education levels, and more.
A good starting point is to select one simple question, such as:
How has our town’s population changed over time?
What languages are spoken in our school district?
How does our county compare with the state average?
What age groups make up our community?
How many people in our area live in apartments versus houses?
Once you have a question, find a data source that students can understand. Public census websites often provide tables, maps, charts, and downloadable spreadsheets. For younger students, it helps to simplify the data or present it in a chart with labels and visuals. Older students can work directly with raw numbers and create their own analysis.
A useful teaching tip is to start with a familiar place. Students may be more interested in census data about their city, neighborhood, or state than data about a distant region. Local connections make the activity more meaningful.
Classroom Activity Ideas Using Census Data
There are many ways to turn census data into lessons that are interactive and age-appropriate. Below are some practical ideas teachers can use or adapt.
1. Population Comparison Charts
Have students compare population numbers between two or more places. This could be:
Two cities
Two states
Two neighborhoods
The class’s town and the national average
Students can create bar graphs or pie charts to show the differences. Afterward, ask them to describe what they notice.
Example prompts:
Which area has the largest population?
Which one is growing faster?
What might explain the difference?
This activity is especially useful in math and geography because it helps students practice graphing and interpretation skills.
2. Community Snapshot Project
Ask students to create a “snapshot” of a community using census data. In small groups, they can research one location and gather data on:
Population
Median age
Household size
Education levels
Language diversity
Housing type
Then students can design a one-page profile or mini-poster about the area. They should include a few facts, one or two graphs, and a short written summary.
This project works well for middle and high school students because it combines research, data analysis, and presentation skills. It also encourages collaboration and creativity.
3. Make-Your-Own Infographic
Infographics are a great way to help students organize and present data visually. Teachers can ask students to turn census information into an infographic with titles, symbols, charts, and short explanations.
For example, if students are studying language diversity, they might create an infographic showing:
The most common languages spoken at home
The percentage of multilingual households
How language patterns compare across regions
This activity supports visual literacy and gives students practice summarizing complex information clearly. It can also be used in technology classes if students create the infographic digitally.
4. Math Word Problems from Real Data
Census data can be turned into custom math problems that feel more relevant than textbook exercises. Teachers can create word problems based on actual population figures, percentages, or ratios.
Examples:
If a town’s population increased from 12,000 to 15,000, what was the percentage increase?
If 30% of households have three or more people, how many households is that in a community of 8,000 households?
If one school district has 18,000 residents and another has 24,000, how many more residents does the second district have?
Students can also write their own word problems using census data. This strengthens both math understanding and communication skills.
5. Mapping Population Patterns
Maps help students see how census data varies across regions. Teachers can use simple printed maps or digital tools to show population density, age distribution, income levels, or housing patterns.
Students might color-code a map based on census categories and then answer questions such as:
Where is the population most concentrated?
Which areas have the highest percentage of children or older adults?
What patterns do you notice across urban and rural areas?
This activity is especially effective in geography and social studies classes. It helps students connect numbers to place and space.
6. Debates and Evidence-Based Writing
Census data can support opinion writing and class debates. Once students analyze the data, they can use it as evidence to defend a claim.
Possible discussion topics include:
Where should a new school be built?
Which neighborhood needs more public transportation?
What services might a community need based on its age distribution?
How should local leaders respond to population growth?
Students can write a paragraph, essay, or speech using census evidence. This teaches them how to support arguments with data rather than opinion alone.
7. Compare Then and Now
Historical census data is especially useful for showing change over time. Students can compare older census records with current data to explore how communities evolve.
They may discover:
Population growth or decline
Changes in family size
Shifts in occupations or industries
Increasing diversity
Differences in housing or education levels
A history class might examine how a city changed after a major event, such as industrialization or migration. Students can discuss why the changes happened and what they reveal about the broader historical context.
Adapting Census Activities for Different Grade Levels
Census data can be used with learners of many ages, but the complexity of the task should match the students’ developmental level.
Elementary School
For younger students, keep the data simple and visual. Focus on counting, comparing, and describing.
Ideas include:
Class graphs
Picture charts
Simple bar graphs
Comparing two communities
Sorting household or population categories
Use guided questions and concrete examples. Students should spend more time observing and discussing than calculating.
Middle School
Middle school students can handle more comparison, interpretation, and basic analysis. They can work with percentages, ratios, and patterns. Activities might include:
Creating charts from data tables
Comparing counties or states
Writing short summaries
Investigating how different categories relate to one another
This age group also enjoys projects and group work, so community profiles and infographics work especially well.
High School
High school students can work with more advanced data analysis. They can investigate trends, make claims, and explain patterns using evidence.
Possible tasks:
Analyzing changes over several decades
Comparing multiple regions
Creating graphs in spreadsheet software
Writing research papers or persuasive essays
Discussing policy implications of census trends
Students can also explore correlations, such as links between education and income or population density and housing type.
Cross-Curricular Connections
One of the best things about census data is that it fits naturally across subject areas.
Math
Calculate percentages, averages, and growth rates
Create graphs and charts
Interpret ratios and proportions
Social Studies
Study population movement and migration
Explore political representation and redistricting
Examine how demographics influence community services
Language Arts
Write evidence-based claims
Summarize data in reports
Present findings in speeches or essays
Science
Connect demographic trends to environmental issues
Explore how population density affects land use, water, and energy
Discuss public health patterns
Technology
Use spreadsheets and data visualization tools
Build digital posters or interactive reports
Practice research and citation skills
These connections make census data more than just a one-time lesson. They turn it into a meaningful bridge between subjects.
Tips for Teaching with Census Data
To make classroom activities successful, keep a few practical tips in mind.
Keep the Questions Focused
Students work best when the task is clear. Instead of asking them to study everything in the census, choose one or two specific questions.
Use Age-Appropriate Data
Simplify charts for younger students and provide more detailed tables for older ones. Too much information can overwhelm learners.
Teach Data Vocabulary
Introduce important terms such as:
Population
Percentage
Median
Household
Density
Census
Understanding these words helps students interpret data accurately.
Make It Relevant
Choose locations and topics that connect to students’ lives. Local data often leads to better engagement.
Encourage Discussion
Ask open-ended questions so students move beyond reading numbers and start thinking critically. For example:
What surprises you?
What patterns do you notice?
What might explain this trend?
What questions do you still have?
Check for Accuracy and Context
Students should know that numbers do not explain everything by themselves. Help them consider context, such as economic changes, migration, or local history. This builds deeper understanding and prevents oversimplified conclusions.
Example Lesson Plan: Exploring Your Community
Here is a simple lesson flow teachers can use:
Warm-up: Ask students what they know about their community.
Introduce the data: Show a few census facts about the local area.
Group work: Students analyze one category, such as age, language, or housing.
Create a product: Each group makes a chart, poster, or short report.
Share findings: Groups present one insight and one question.
Reflection: Students write about what they learned and why it matters.
This structure works because it combines observation, analysis, collaboration, and reflection. It can also be adapted into a single class period or expanded into a multi-day project.
Frequently Asked Questions
1. What is the U.S. Census Bureau’s Statistics in Schools program?
Statistics in Schools is a free Census Bureau program that provides teacher-designed classroom activities, worksheets, data tools, maps, videos, and other resources that use real census information.
2. What subjects can teachers teach with census data?
Teachers can use census data in mathematics, geography, history, social studies, English, economics, sociology, science, and technology. Activities can involve graphing, percentages, mapping, evidence-based writing, and community comparisons.
3. What types of information can students find in census data?
Students can explore information about population, age, households, housing, education, employment, income, businesses, languages, and geographic areas. Available categories depend on the specific Census Bureau survey or data product.
4. What is the easiest Census Bureau data tool for beginners?
QuickFacts is a practical starting point because it presents commonly requested statistics for the nation, states, counties, cities, and towns. More advanced students can use data.census.gov for detailed tables and geographic comparisons.
5. Are census classroom activities available for different grade levels?
Yes. Statistics in Schools offers activities for pre-K, elementary, middle, and high school students. Teachers can select materials based on grade level and adapt them to their students’ abilities and learning objectives.
Census data gives teachers a powerful way to bring real-world learning into the classroom. It helps students practice math, research, writing, and critical thinking while also learning about the communities they live in. Whether they are comparing population trends, designing infographics, or writing evidence-based arguments, students gain valuable skills from working with authentic data.
With the right questions and a little creativity, teachers can turn census data into engaging classroom activities that are meaningful, flexible, and easy to connect across subjects.
Jennifer, M.Ed., holds a degree in Higher Education Administration, with
a focus on U.S. college financial aid, admissions policy, and student
support systems. She researches and writes about scholarships, federal
aid programs, and the college planning process to help students and
families make informed, well-supported decisions.